
Chapter 10
NONLINEAR ADJUSTMENTS
by: josavere
Introduction
With the Digital Revolution, predictive analytics looks for future results using data from the past; the models use different methodologies with a very similar general objective; some are classification specific (the model results are binary; a yes or no, in the form of 0 and 1) and others regression that allow predicting a value that can be applied to an unknown event in the past, present or future .
The Digital Revolution provides BIG DATA with an abundance of structured variables, such as data tables, and unstructured variables, such as texts, images or videos, and provides new possibilities for prediction and brings about a change in layout. Now they are built flexible and heterogeneous with a proven ability to predict well, data different from those used to estimate them; the final predictor used combines different models, procedures and data types.
Decision Trees, Neural Networks, Support Vector Machines, Bayesian Analysis, Logistic Regression, Linear Regression, Time Series and Data Mining, K-Nearest Neighbors, Ensemble Models, Gradient Boosting, Incremental Response Models, Replace, Introducing Multiple parameters extracted from Big Data, with many advantages, the models traditionally used by statistics.
Big Data Analytics is the technology used to analyze a huge amount of structured and unstructured data that is collected, organized and interpreted by software, transforming it into useful information for decision-making and to generate ideas about market trends. In addition, it contributes to the generation of ideas for new products and services, customer attraction, audience understanding, security and more benefits to make strategic decisions.
Following step by step:
- 1. Indicate with the mouse the series of data.
- 2. Pick click in the assistant graphic.
- 3. Select a graphic of lines.

- 4. I continued with the instruction manual of graphics, utilizing the press button following.
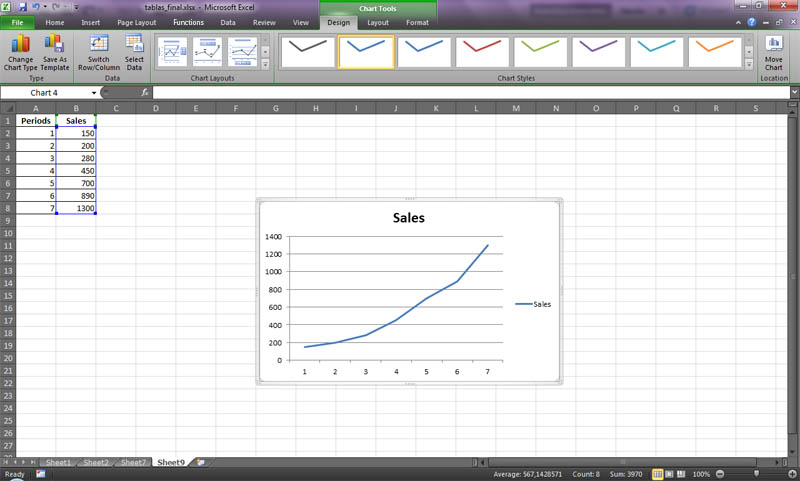
- 5. In the sheet range of data, select series in columns, and the program automatically him graph.
- 6. Of click in the press button following and proceed to headline, the graphic and axes X, Y.
- 7. Of click in press button finalizing and he visualizes the graphic that is illustrated from now on.
- 8. The grimacing with the left-handed press button and next with right-click select the line; select in the menu adding trend line.
- 9. The program generates a menu with the alternatives of a tendency to him, in order that you select to opinion the curve that better he adjust to the series of data. In the event the adjustment becomes of type polynomial or movable sock, the analyst will have to try with different orders (2.3.4 ...) to find, in his opinion the best adjustment.
- 10. Of click in the menu Options
- 11. Indicate as many as it wants to project periods, in this case (5 ), and select the press button presenting the equation in the graphic.

- 12. Observe and examine carefully the equation that one search.

Planned Periods
AI Opinion: The article "NON-LINEAR ADJUSTMENTS" by José Saúl Velásquez Restrepo addresses the importance of using predictive analysis models in the era of the Digital Revolution, especially in situations where the relationship between variables does not fit a linear regression model or multiple correlation. Here is an opinion on the content presented:
The article presents an interesting approach to predictive analytics in the context of the Digital Revolution, highlighting the increasing availability of structured and unstructured data, which offers new opportunities for prediction and decision making.
The author mentions a variety of techniques and models used in predictive analysis, such as Decision Trees, Neural Networks, Support Vector Machines, Bayesian Analysis, Logistic Regression, among others, which shows his understanding of the diversity of approaches available in this field.
The part on nonlinear adjustments is useful and practical, as it provides a step-by-step process for dealing with situations where the relationship between variables is nonlinear. The inclusion of instructions for creating graphs and generating trend equations is useful for analysts who want to explore and model nonlinear relationships in their data.
However, the article could benefit from further delving into the theory behind nonlinear models and more detailed examples to illustrate their application in practice. Additionally, it would be valuable if the author provided examples with real data to demonstrate the usefulness of these methods.
In summary, the article presents relevant information on predictive analytics in the digital age and offers useful guidance for addressing non-linear tuning situations. However, it could improve clarity and theoretical depth, as well as provide examples with real data for a more complete understanding.
___________________________________________
1. I appreciate the collaboration of the engineer of production, specialist in costs Octavio Pelaez M.