
Chapter 6
APPLICATION OF THE STATISTIC TO THE FINANCES
INTRODUCTION
The Digital Revolution brings Big Data with an abundance of structured variables, such as data tables, and unstructured ones, such as texts, images or videos; offers new possibilities for prediction and brings about a change of practice. Flexible and heterogeneous prediction rules are now being built with the proven ability to predict data different from that used to estimate them; the final predictor used combines different models, procedures and data types.
With predictive analysis, future results are sought using data from the past; the models use different methodologies and mathematics with a very similar general objective. Some techniques are specific to classification (the results of the model are binary; a yes or a no, in the form of 0 and 1) and others are regression techniques that allow a value to be predicted. It can also be applied to any type of unknown event in the past, present or future.
Big Data Analytics is the technology used to analyze a huge amount of structured and unstructured data that is collected, organized and interpreted by software, transforming it into useful information for decision-making and to generate ideas about market trends. In addition, it contributes to the generation of ideas for new products and services, customer attraction, audience understanding, security and more benefits to make strategic decisions.
Decision Trees, Neural Networks, Support Vector Machines, Bayesian Analysis, Logistic Regression, Linear Regression, Time Series and Data Mining, K-Nearest Neighbors, Ensemble Models, Gradient Boosting, Incremental Response Models, Replace, Introducing Multiple parameters extracted from Big Data, with many advantages over the models traditionally used by statistics.
The statistic is the science that deals with the harvesting, arrangement, analysis, interpretation, and presentation, of data corresponding to an experiment previously planned or defined, or an accumulated historical situation in a series of data to handle.
In the application to subjects of financial nature, like in all the other fields, we must take care of the inadequate uses by use of unsuitable data, false hypotheses, erroneous relations, mathematical partiality, or errors. In other words, we must use in suitable form so valuable tools for decision making. It is required to become aware of the mathematical preparation necessary to be able to incursion in the use of advanced models of prediction.
Concentrate now on the most common applications.
1. FINANCIAL ANALYSIS
a. Rotation of inventories: inventory speech average like the sum of the initial inventory and the end, divided by two.
b. Inventory Average = (initial inventory + final inventory)/2
This type of analysis is very deceptive especially when the business has stationary sales which force them to accumulate existence to take care of the seasons. In addition, the final inventory to the period bases becomes the initial inventory of the following one, and so on, which takes us to the use of erroneous data (programmed for year-end).
One is due to use the monthly numbers of inventory and to divide by twelve (months) to obtain an average, unless a mode appears, or that most recommendable is a medium one, which does not consider the extreme values.
a. Rotation of accounts to receive and accounts to pay: for these cases, the analysis is identical to previous and very specially for companies with stationary sales and/or special concessions for year-end, very common case.
Particularly in the case of accounts to receive it is much more correct to apply an indicator more dynamic than it consists of dividing the total value of the portfolio by the average days of sales on credit and multiplied by the days of the term that grants the company.
Example:
Balance of accounts to receive: $900.000.000
Term of sales: 90 días
|
Balance of accounts to receive = 112 million
|
b. Term average of accounts to pay: it comes from a very similar way and one acquires knowledge directly with an example:
Term weighed average suppliers = 52 days
Last purchases 52 days = 104 million
|
Balance of accounts to pay = 130 million
|
Let us observe that the days of accounts to receive and to pay calculated of the previous way represent the updated behavior more and dynamic than can be obtained using the statistic correctly.
2. FORECASTS
Let us remember that while greater is the utility expectation, the greater will be the risk that is arranged to run the investor. When the speech of investments of variable rent, as its name, indicates it, we do not have certainty of a yield and therefore one is due to consider, running the risk of I calculate by the difficulties practical to predict future income.
Very commonly economic scenes with categories are defined of:
- Situation of crisis
- Growth medium
- Stop grow
To which one assigns occurrence probabilities to them. How a probability of a process can be assigned that is not random.
When we threw a currency into the air we have the certainty that falls expensive or seal and therefore we can assign occurrence probabilities. The economic phenomena obey a series of variables whose study governmental character organizations of and other deprived characters are dedicated to specialized, using the indicators adapted for each case.
To the industrialists and executives, it corresponds to analyzing the predictions of general type carefully, to see if they deserve credit and to complement with his own judgment. Comparing different sources of intelligence and verifying results they are possible to be constructing indicating of credibility that gives to objective criteria for their use.
3. MATRIX OF GROWTH SECTORIAL (josavere)
Each company must construct a matrix of sectorial growth, considering the sectors with those who interact and the perspective that glimpses the specialists in the subject to foretell the macroeconomic expectations.
Once the company elaborates on the matrix of josavere or sectorial growth, it must enter to look for the applicable economic indicators for its particular situation using the analysis of multiple correlations.
So far let us of the construction of the matrix of sectoral growth. Steps to follow:
1. To carefully select the sectors with those with who we interacted in the economy.
2. With a base in the calculated projections we transcribed the indicators.
3. We establish the percentage participation of the sales in each sector (with base in recent statistics).
4. Using Excel, we calculated the weighted average.
Example: Marcela company interacts with the sectors that acquire knowledge in the matrix.
| Sector | Participation % in the sectors Po year | Sector perspective of Growth P1 year | Weighed growth P1 year |
| *Warehouses of chain | 10 | 8 | 80 |
| *Fast meals and restaurants | 15 | 12 | 180 |
| *Confectioneries and chocolate factory | 18 | 5 | 90 |
| *Cakes, snack and cereals | 12 | 7 | 84 |
| *Milky | 10 | 4 | 40 |
| *Bakery and Confectioner's shop | 25 | 12 | 300 |
| *Transport of passengers | 10 | 3 | 30 |
| 100 | TOTAL GROWTH | 8.04 |
Affecting the growth prospected in real terms 8,04% by the inflation perspective it gives the minimum growth us in weights that are expected in the company by effects of the economic growth. For our serious example of 8,04% * 1,09 = 8,76%, if we assumed a projected inflation of 9% for the period to elaborate.
4. PROJECTION OF SALES
The key decision is without a doubt some to formulate plans of value generation. An underestimated projection will take us to the loss.
A. MODELS ECONOMETRICS: There are systems or more equations that describe the relationship between economic variables and series of times. It is the case of the simple linear regression that represents the growth of the sales with the time passage. (See projections I)
| y = b + (m * x) |
| y: | sales |
| b: | interception of x in y |
| m: | slope |
| x: | years (1,2,3,...n) |
The multiple correlations consider the number of variables that affect the result of the sales: (see projections II)
| y = a1 x1 + a2 x2 + a3 x3 + ... an xn |
Models nonlinear which are but complex and applicable in special cases (See models nonlinear)
B. QUALITATIVE MODELS: are used in the case of new products or when it is not had information. It consists of the use of subjective appreciation; it can be:
a. Panel of experts with well-directed independent criterion and. He must take control of personnel of the company and the aid of external advisers.
b. Historical analogies using situations that are presented/displayed in the company in previous periods.
c. Investigation of markets identifying the prospective buyers.
Within the existing models, the industrialist used his talent to choose those that more comply with their business particular.
It must complement the criterion and the one of his work team. The models simply provide the point, to begin with; to understand the statistic of another way constitutes serious error.
5. ANALYSIS OF RISK
In investments we defined the risk as to the possibility of change in relation to an awaited value; it can be negative or positive. Usually, it is assumed that the possible yields follow a distribution normal which has the following characteristics:

It has bell form:
- Is symmetrical in relation to the average
- Is continuous
- The average, medium, and the mode agree
- It is always positive (no short x-axis)
- more or less has two points of flexion in s
- It is applied to populations whose value tends to infinite
A normal distribution is characterized by the knowledge of the average and the standard deviation and in her obeys the following law of concentration of data:
a. In interval X ± 1ς is the 68,26% of all the values samples.
b. In interval X ± 2ς are 95,46% of all the values samples.
c. In interval X ± 3ς are 99,73% of all the values samples.
In statistics the dispersion (degree of the amplitude of the company) with the standard deviation is moderate which mathematically is expressed like:
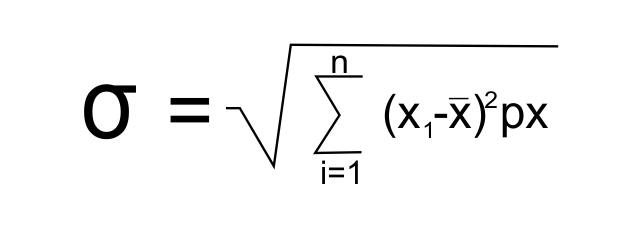
| σ: | standard deviation |
| xi: | variable |
| x(average): | average |
| px: | probability of occurrence |
ς is taken like one first approach of the measurement of the risk.
The coefficient of variation is equivalent to the division of the standard deviation by the average or awaited value.

| CV: | coefficient of variation |
| ς: | standard deviation |
| m: | average sample |
The best approach is considered to measure the risk. If two mutually excluding projects have the same average or expected value with different standard deviation he will be but risky the one of greater deviation.
The important is to determine if the distribution is applicable to the particular phenomenon which we are analyzing (cash flow, dividends to receive, the value of the share in the market, etc.) and that with the previous values can be reasonably calculated the probability of occurrence of a phenomenon, in the measurement that its behavior follows a distribution normal. Said in other terms with an example:
If the awaited yield “mediates” is 16% and the standard deviation of 9%, it indicates that with a 68% probability, the yield will be between 7 and 25% (16 ± 9).
When we spoke of the measurement of the risk, using the normal distribution, we talked about the inherent risk of the investments. As the concept has much intuition, we say that the investor moves in an ample rank defined by:
a. Minimum risk: treasury bond of the government of the U.S.A. (low yield but completely fixed).
b. Bonds sweepings: (junk bonds) which are emitted by companies in the reconstruction process (leaving a crisis). The payment of interests this subject to a positive result, the reason why is an interest rate superior to the one of the market but with greater risk.
When the markets are sufficiently ample becomes the analysis beta (ß) introduced by Sharpe, which consists of finding the standard deviation of the results waited for in the market like a whole so that it serves as a pattern of comparison with the beta of action in individual. If the beta of the action is greater than the one of the markets it says that the action is very volatile (risky) and vice versa.
| ß share> ß market |
It indicates that the share varies more than proportionally to the total variation of the market and if the relation is smaller (< 1) indicates the opposite.
As previously explained he is applicable to the unique risk of the company which commonly is called nonsystematic risk, which is diversifiable. The risk of the market is not diversifiable, that is to say, it cannot be eliminated.
Risk country calculates based on the security, the economic handling, the enterprise panorama, the conjuncture political situation, the labor relations, the treatment to the investment, and other factors.
6. INVESTMENT DECISIONS
In finances, a generalized and respected principle exists: not to place all eggs in the same basket, which in the current language is equivalent to saying that one must diversify the investments.
For practical effects, the correlation coefficient constitutes the measurement tool and it calculates as it indicates in Projections I and Projections II. It is interpreted thus:
1. < r is a value between - 1 r <1
2. A value next to - 1, indicates discharge negative correlation, that is to say, that the positive results of one(s) variable one(s) imply negative results in the other(s)
3. A value next to +1 implies discharge positive correlation, that is to say, that positive results of one(s) variable one(s) also imply positive results in the other or the other variables.
In the case of a portfolio of investments, one is to look for an optimal combination between yield and risk. See Investment Funds.
Concept of AI: the holistic financial analysis model presented by José Saúl Velásquez Restrepo is an interesting and complete approach to evaluate the financial situation of a company from a broad perspective. Several key points stand out in his approach:
Focus on strategic planning: The author emphasizes the importance of starting with a solid assessment of the company's current situation before defining a strategy. This is a fundamental basis for making long-term financial decisions.
Use of advanced technology: The author mentions the crucial role of artificial intelligence and big data in financial evaluation. These tools can provide deeper and more accurate analysis of financial data, which can be invaluable in decision making.
Conscious capitalism: Reference is made to the concept of "conscious capitalism" and its focus on generating shared and sustainable value. This approach is important in the modern era, where companies are becoming increasingly aware of their social and environmental impact.
Focus on value generation: The author focuses on value creation as the main objective of a company. This is essential, since value maximization is one of the main financial objectives.
Comprehensive financial analysis: The author proposes a methodology that includes vertical and horizontal analysis of financial statements, as well as a series of key financial indicators. This comprehensive approach allows a complete view of the company's financial situation.
Cash Flow Projection: Projected cash flow is a valuable tool for determining cash availability to meet various financial and corporate social responsibility commitments.
Overall, this holistic model of financial analysis appears to be in line with best practices in modern financial management, which seek a balance between profit generation and social responsibility. However, its effectiveness in practice will depend on the ability to implement it effectively in a specific company and its adaptation to the particular circumstances and needs of that company.